Skip to content
    1. Overview
    2. Alternative Managers
    3. Consultants
    4. Corporations
    5. Family Offices
    6. Financial Advisors
    7. Financial Institutions
    8. Insurance Companies
    9. Investment Managers
    10. Nonprofits
    11. Pension Funds
    12. Sovereign Entities
  1. Contact Us
  2. Search
Investment Perspective | 12.27.24

High Hopes, Solid Grounds

We prefer equities over fixed income, in particular U.S. equities as the outlook for the U.S. economy is solid and promising.

KEY POINTS

What it is

We analyze key global economic and market trends for the next 12 months and how they affect our global policy model asset allocation.

Why it matters

Robust earnings along with lower inflation and interest rates have driven remarkable U.S. equity gains this year, but global political risks loom large in 2025.

Where it's going

We prefer equities, in particular U.S. equities, over fixed income. However, high yield bonds remain attractive.

We believe the macroeconomic outlook for the U.S. in 2025 is solid and promising. Analysts project a GDP growth rate of around 2.4%, driven by a combination of strong consumer spending, robust private sector balance sheets, and a historically strong labor market. The Federal Reserve is expected to continue its easing cycle, with interest rate cuts likely to support economic expansion.

Inflation is anticipated to remain within manageable levels, with core PCE inflation projected to slow to 2.2% by late 2025. This easing of inflationary pressures will allow the Federal Reserve to maintain accommodative monetary policies, further bolstering economic growth.

With regards to the stock market, 2024 showcased remarkable performance, with the S&P 500 surging by approximately 28% year-to-date, which would mark its best annual performance since 2019. This strong performance was driven by a combination of factors, including robust corporate earnings, lower inflation rates, and a series of interest rate cuts by the Federal Reserve. The post-election rally further boosted investor confidence, leading to record highs and significant gains across various sectors.

Looking ahead to 2025, the tech cycle remains a central theme. The continued advancement in artificial intelligence (AI) and other innovative technologies is expected to drive further growth in the tech sector. Additionally, expectations are high for more than 12% earnings growth next year, fueled by strong IT capital expenditure and technological innovation.

Geopolitical risks loom large in 2025, with tensions in regions like the Middle East and Asia potentially disrupting global supply chains and impacting investor sentiment. These uncertainties could lead to increased costs for the U.S. defense budget, as the government seeks to bolster national security and respond to international threats. The Department of Defense has already proposed a $849.8 billion budget for 2025, reflecting the need to address these geopolitical challenges.

European economies are still stuck in the mud – fiscal consolidation remains a focus and a potential drag on growth, while political instability in France and Germany is ongoing. The fiscal outlook in China is improving, but domestic consumption continues to face headwinds.

Overall, we maintained a preference for equities over fixed income on the basis that the macroeconomic backdrop will remain supportive. Within equities, TAA continues to prefer the U.S. versus other regions given a better economic backdrop, healthier corporate fundamentals, and lower net downside risk from policies floated by the incoming U.S. Administration. Within fixed income, the committee believes high yield remains attractive given its starting yield of ~7% and an expectation of low defaults.

— Peter Wilke, CFA – Head of Tactical Asset Allocation, Global Asset Allocation


UNEXPECTED, YET FREQUENT: STOCK MARKET SURGES NEARLY 30%

Strong U.S. stock market performance was not expected in 2024, but it fell in line with historical data.

exhibit1-comparison of annual u.s. stock market returns

Source: Northern Trust Asset Management, Bloomberg. Annual total return data from 12/31/1926 through 12/29/2023. S&P 500 index. Numbers from Ibbotson until 1988. Past performance is not indicative or a guarantee of future results.

Interest Rates

We're remiss to bring up the debt ceiling this time of year, but, like it or not, the debt ceiling comes back into force when we turn the calendar into 2025. However, the political makeup of Washington next year should take the extreme tail-risk of a technical default on U.S. Treasury securities off the table. We'll leave fiscal policy and deficits aside for the time being to say we're thankful to not stress about "x-dates" this holiday season.

That's not to say there won't still be some impact on money markets in the early stages of 2025. While it's unlikely Congress will fail to find a resolution to the debt ceiling, it's also unlikely it will be their top priority after being seated, likely resulting in disruptions to Treasury Bill issuance patterns in the first half of 2025. The Treasury Department will have to abide by the debt ceiling until its resolved, resulting in less T-Bill issuance than otherwise expected, and downward pressure on money market rates all else equal. While we view this as likely to impact T-Bill yields in the short term more than money market fund yields, it's a relatively small disruption compared to a full-fledged debt-ceiling episode. 

— Dan LaRocco, Head of U.S. Liquidity, Global Fixed Income


DECEMBER DEBT CEILING UPDATE

Less T-Bill issuance may result in downward pressure on rates.

exhibit2 compares 3- and 6-month treasury rate to Fed funds rate.

Source: Northern Trust Asset Management, Bloomberg. Data from 12/29/2023 through 12/16/2024. Historical trends are not predictive of future results.
 

  • The debt ceiling comes back into force in January.
  • While technical default appears to be off the table, we do expect lumpy, reduced Treasury Bill issuance in the first half.
  • We wouldn’t be too concerned about debt ceiling headlines as we head into 2025.

Credit Markets

The high yield (HY) market saw strong outperformance last month following the U.S. elections. Market participants interpreted the “red sweep” as a positive backdrop, leading high yield spreads to grind tighter. While HY spreads remain historically tight, it’s worth noting that there have been multiple instances where the HY bond index trades at tight levels for extended periods of time. Despite the strong returns recently, January has proven to provide outsized returns. January’s average HY bond return over the past 38 years of +1.55% exceeds the average for all other months by 97 basis points (bps). Since 1987, high yield returns have been positive 84% of the time in January. While January is typically the best calendar month for HY, the 30-day stretch from mid-December to mid-January have provided even better returns on average, +1.93%, or more than four times a typical 30-day stretch.1

There are always exceptions to the “January Effect”, like in January 2022 where high yield saw a loss of -2.77%, which was the second worst January on record. This loss was driven by the Fed’s hawkish narrative, however heading into the new year, that narrative has flipped which could lead to January looking like past history.

— Eric Williams, Head of Capital Structure, Global Fixed Income


HIGH YIELD JANUARY EFFECT

January has proven to provide historically outsized returns.

exhibit3 - average high-yield bond returns

Source: Northern Trust Asset Management, Federal Reserve, J.P. Morgan. Quarterly data from 12/31/1951 through 6/30/2024. The financing surplus1 is proxied by the difference between corporate cash flows and capex as a percentage of U.S. GDP. Historical trends are not predictive of future results.
 

  • While high yield spreads remain historically tight, it’s worth noting that there have been multiple instances where the high yield bond index traded at tight levels for extended periods of time.
  • January’s average HY bond return over the past 38 years of +1.55% exceeds the average for all other months by 97 basis points. Since 1987, high yield returns have been positive 84% of the time in January.
  • We continue to think high yield is attractive.

EQUITIES

Since the U.S. elections on November 5th, U.S. large caps have rallied 4.9% through December 10th. Excluding Nvidia, all Mag-7 stocks were solid and contributed a majority of the returns over this period. U.S. small caps fared only modestly better at 5.3% despite initial optimism on Trump-related themes surrounding deregulation and reshoring. Developed ex-U.S. and Emerging Markets have also performed well, delivering double-digit local currency returns in each of the last two years. However, a stronger dollar in 2024 has reduced returns for dollar based investors by 4.6% and 5.7%, respectively.

Barring a December sell-off, U.S. large caps will post their second consecutive year of at least 25% returns, stretching the 1-year forward price-to-earnings ratio to 24x. However, expected double-digit earnings growth over the next two years, a healthy consumer, and continuing expectations for interest rate cuts provide support for our continued preference for U.S. equities. Valuations overseas are in line with historical averages and look cheap relative to the U.S., but growth catalysts are lacking, particularly in parts of Europe. We maintain an underweight to Developed ex-U.S. and a slight overweight to Emerging Markets.

— Jordan Dekhayser, Head of Equity Client Portfolio Management


U.S. ON TOP, BUT OTHER REGIONS WERE SOLID

Returns to U.S. investors impacted by stronger dollar.

exhibit4 - compares u.s. vs developed ex-u.s. vs emerging markets equity returns

Source: Northern Trust Asset Management, Bloomberg. Total return data from 12/31/2023 through 12/10/2024. Local currency gross total return indexes shown. Past performance is not indicative or a guarantee of future results. Index performance returns do not reflect any management fees, transaction costs or expenses. It is not possible to invest directly in any index.
 

  • The second consecutive year of at least 25% U.S. large cap equity gains casts a shadow over solid double-digit local currency returns from other regions.
  • Valuations appear stretched in the U.S., but we feel they are justified given the earnings growth outlook.
  • We reaffirm our constructive view on equities, maintaining overweights to the U.S. and, to a lesser degree, emerging markets. We remain underweight developed ex-U.S. equities.

REAL ASSETS

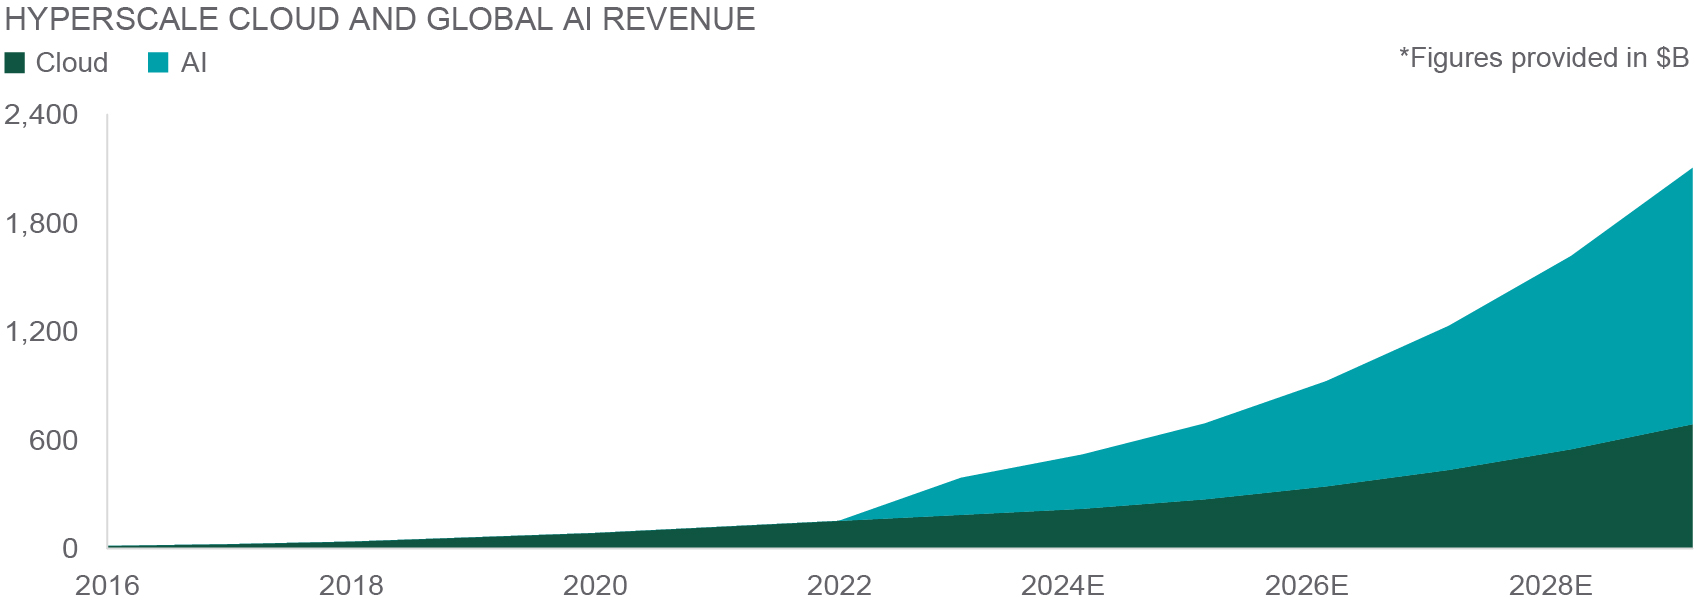
Over the past decade, the global demand for power has continued to surge. First came the growth of the “cloud”, driven by the largest hyperscalers in the world. These users have driven data center growth and capital expenditure spending since 2016. Today’s generative AI needs represent a game changer for the utility and power-generation sectors. AI revenue is expected to grow at an average annual rate of 38% over the next 6-7 years (Structure Research, Company Filings). The launch of Chat GPT has catalyzed OpenAI revenue growth. Within 60 days of launching, ChatGPT eclipsed 100 mm users, and 20 months later they have scaled from $0 to $3.6 B of recurring revenue (ChatGPT, New York Times). With many end-users looking for large scale campuses four times the size of the last generation just three years ago, healthy power and data center demand is expected to continue.

Per CBRE, utility and power-producer earnings growth estimates could reach high single-digits over the next two years. With the contributions of strong fundamentals and earnings growth, robust income yields and discounted valuations, we are optimistic on the infrastructure sector heading into 2025.

— Jim Hardman, Head of Real Assets, Multi-Manager Solutions


AI SURGE

Infrastructure growth is accelerating with AI.

chart5 - hyperscale cloud and global a i revenue

Source: Northern Trust Asset Management, Census Bureau. Annual data from 12/31/2013 through 10/31/2024. Historical trends are not predictive of future results.
 

  • Driven by AI requirements, expectations for global power demand continue to rise.
  • Utility and power-producer earnings growth estimates may reach high single-digits over the next two years.
  • We remain overweight global listed infrastructure on strong fundamentals, robust earnings growth, and discounted valuations.

Base Case Expectations

Base Case Expectations

Global Policy Model chart

Source: Northern Trust Capital Market Assumptions Working Group, Investment Policy Committee. Strategic allocation is based on capital market return, risk and correlation assumptions developed annually; most recent model released 8/9/2023.The model cannot account for the impact that economic, market and other factors may have on the implementation and ongoing management of an actual investment strategy. Asset allocation does not guarantee a profit or protection against a loss in declining markets. GLI = Global Listed Infrastructure, GRET Resources. Unless otherwise noted, the statements expressed herein are solely opinions of Northern Trust. Northern Trust does not make any representation, assurance, or other promise as to the accuracy, impact, or potential occurrence of any events or outcomes expressed in such opinions.


Unless noted otherwise, data on this page is sourced from Bloomberg as of December 2024.

IMPORTANT INFORMATION

Northern Trust Asset Management (NTAM) is composed of Northern Trust Investments, Inc., Northern Trust Global Investments Limited, Northern Trust Fund Managers (Ireland) Limited, Northern Trust Global Investments Japan, K.K., NT Global Advisors, Inc., 50 South Capital Advisors, LLC, Northern Trust Asset Management Australia Pty Ltd, and investment personnel of The Northern Trust Company of Hong Kong Limited and The Northern Trust Company.


Issued in the United Kingdom by Northern Trust Global Investments Limited, issued in the European Economic Association (“EEA”) by Northern Trust Fund Managers (Ireland) Limited, issued in Australia by Northern Trust Asset Management (Australia) Limited (ACN 648 476 019) which holds an Australian Financial Services Licence (License Number: 529895) and is regulated by the Australian Securities and Investments Commission (ASIC), and issued in Hong Kong by The Northern Trust Company of Hong Kong Limited which is regulated by the Hong Kong Securities and Futures Commission.


For Asia-Pacific (APAC) and Europe, Middle East and Africa (EMEA) markets, this information is directed to institutional, professional and wholesale clients or investors only and should not be relied upon by retail clients or investors. This document may not be edited, altered, revised, paraphrased, or otherwise modified without the prior written permission of NTAM. The information is not intended for distribution or use by any person in any jurisdiction where such distribution would be contrary to local law or regulation. NTAM may have positions in and may effect transactions in the markets, contracts and related investments different than described in this information. This information is obtained from sources believed to be reliable, its accuracy and completeness are not guaranteed, and is subject to change. Information does not constitute a recommendation of any investment strategy, is not intended as investment advice and does not take into account all the circumstances of each investor.


This report is provided for informational purposes only and is not intended to be, and should not be construed as, an offer, solicitation or recommendation with respect to any transaction and should not be treated as legal advice, investment advice or tax advice. Recipients should not rely upon this information as a substitute for obtaining specific legal or tax advice from their own professional legal or tax advisors. References to specific securities and their issuers are for illustrative purposes only and are not intended and should not be interpreted as recommendations to purchase or sell such securities. Indices and trademarks are the property of their respective owners. Information is subject to change based on market or other conditions.


All securities investing and trading activities risk the loss of capital. Each portfolio is subject to substantial risks including market risks, strategy risks, advisor risk, and risks with respect to its investment in other structures. There can be no assurance that any portfolio investment objectives will be achieved, or that any investment will achieve profits or avoid incurring substantial losses. No investment strategy or risk management technique can guarantee returns or eliminate risk in any market environment. Risk controls and models do not promise any level of performance or guarantee against loss of principal. Any discussion of risk management is intended to describe NTAM’s efforts to monitor and manage risk but does not imply low risk.


Past performance is not a guarantee of future results. Performance returns and the principal value of an investment will fluctuate. Performance returns contained herein are subject to revision by NTAM. Comparative indices shown are provided as an indication of the performance of a particular segment of the capital markets and/or alternative strategies in general. Index performance returns do not reflect any management fees, transaction costs or expenses. It is not possible to invest directly in any index. Net performance returns are reduced by investment management fees and other expenses relating to the management of the account. Gross performance returns contained herein include reinvestment of dividends and other earnings, transaction costs, and all fees and expenses other than investment management fees, unless indicated otherwise. For U.S. NTI prospects or clients, please refer to Part 2a of the Form ADV or consult an NTI representative for additional information on fees.


Hypothetical portfolio information provided does not represent results of an actual investment portfolio but reflects representative historical performance of the strategies, funds or accounts listed herein, which were selected with the benefit of hindsight. Hypothetical performance results do not reflect actual trading. No representation is being made that any portfolio will achieve a performance record similar to that shown. A hypothetical investment does not necessarily take into account the fees, risks, economic or market factors/conditions an investor might experience in actual trading. Hypothetical results may have under- or over-compensation for the impact, if any, of certain market factors such as lack of liquidity, economic or market factors/conditions. The investment returns of other clients may differ materially from the portfolio portrayed. There are numerous other factors related to the markets in general or to the implementation of any specific program that cannot be fully accounted for in the preparation of hypothetical performance results. The information is confidential and may not be duplicated in any form or disseminated without the prior consent of (NTI) or its affiliates.


Forward-looking statements and assumptions are NTAM’s current estimates or expectations of future events or future results based upon proprietary research and should not be construed as an estimate or promise of results that a portfolio may achieve. Actual results could differ materially from the results indicated by this information.


Not FDIC insured | May lose value | No bank guarantee