- Who We Serve
- What We Do
- About Us
- Insights & Research
- Who We Serve
- What We Do
- About Us
- Insights & Research
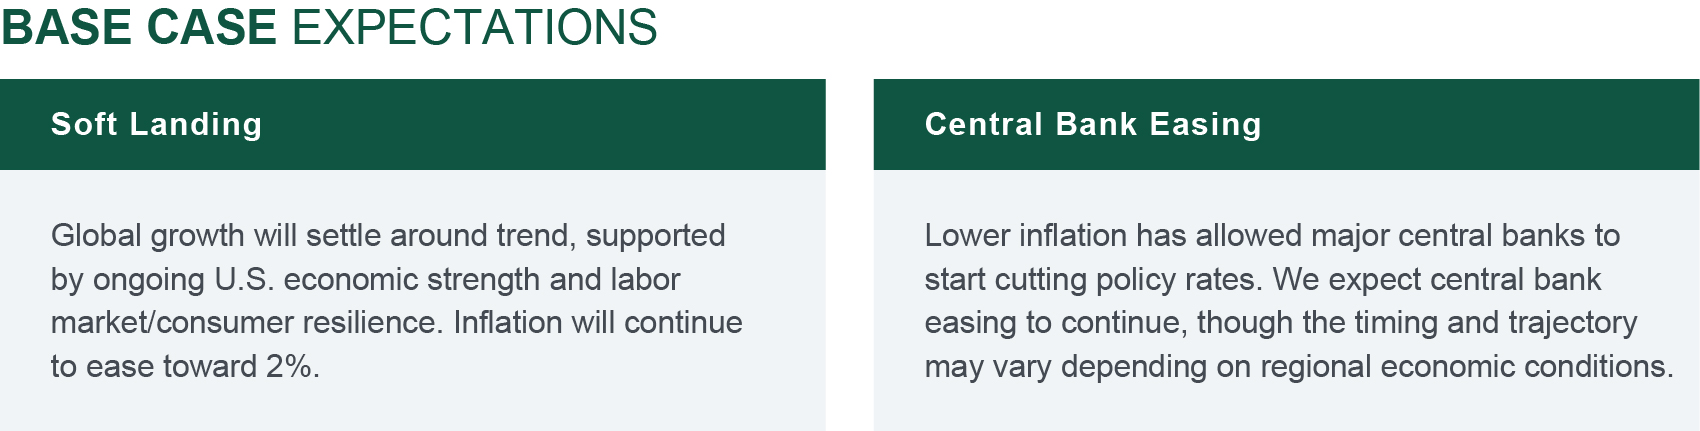
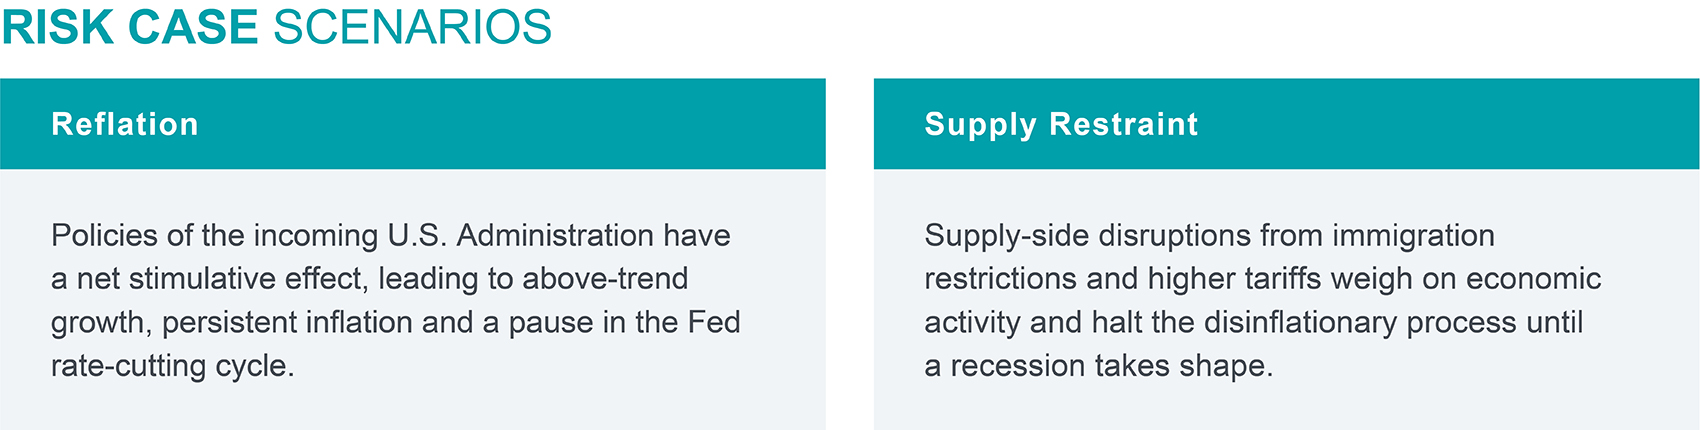
The Price of Progress
We explore how evolving priorities under the new U.S. administration may influence markets and investor outlooks.
KEY POINTS
What it is
We examine the early actions and proposals from the new U.S. administration, focusing on the initial impact on markets and investor sentiment.
Why it matters
Policy changes under the new U.S. administration have the potential to create ripple effects, influencing everything from trade dynamics to long-term growth prospects.
Where it's going
As new fiscal plans and trade policies come into play, markets will assess long-term implications for inflation, debt management, and economic stability.
As the new U.S. administration prepares to take office, financial markets have responded by pushing up the cost of longer-dated bonds. This reflects investor concerns about potential policy shifts and their impact on future inflation and growth. The term premium, which has been relatively low in recent years, could serve as a key indicator of the new administration’s success in fostering economic growth while keeping inflation in check
One of the key concerns under the new administration is the potential for higher tariffs. Such measures could disrupt global trade flows, leading to higher costs for imported goods and raw materials. This, in turn, could reignite fears of a stagflationary environment. In that context, the policy desire to shift the trade balance more in favor towards the U.S. could come at a greater cost in the form of higher refinancing costs to support the large government spending programs. Unsurprisingly, these concerns have also started to weigh negatively on the U.S. stock market in the form of lowering their valuation premium.
Markets currently seem to be assuming a gradual transition regarding changes in tariffs. However, this assumption could prove to be overly optimistic. If tariff changes are implemented more rapidly or aggressively than expected, the resulting economic shock could be more significant. This highlights the importance of assessing the specific proposals that are likely to be announced in the coming months.
Another factor contributing to market uncertainty is the anticipated release of new fiscal plans throughout the year. These plans are likely to take time to be fully implemented, which means their impact on the economy could be gradual and spread over an extended period. Investors will need to stay vigilant as these policies are rolled out, assessing their potential effects on growth, inflation, especially with regards to their impact on growth in 2026.
Given the high levels of debt, rising interest rates create additional constraints on policymakers who might wish to pursue more expansionary policies. The cost of servicing this debt increases as rates rise, leaving less fiscal space for other initiatives. This can limit the government's ability to stimulate the economy during periods of slow growth or recession, adding another layer of complexity to economic policy planning.
— Peter Wilke, CFA – Head of Tactical Asset Allocation, Global Asset Allocation
POLICY AND THE TERM PREMIUM
The potential growth and inflationary impact of the Trump administration’s policies could be reflected in the term premium.
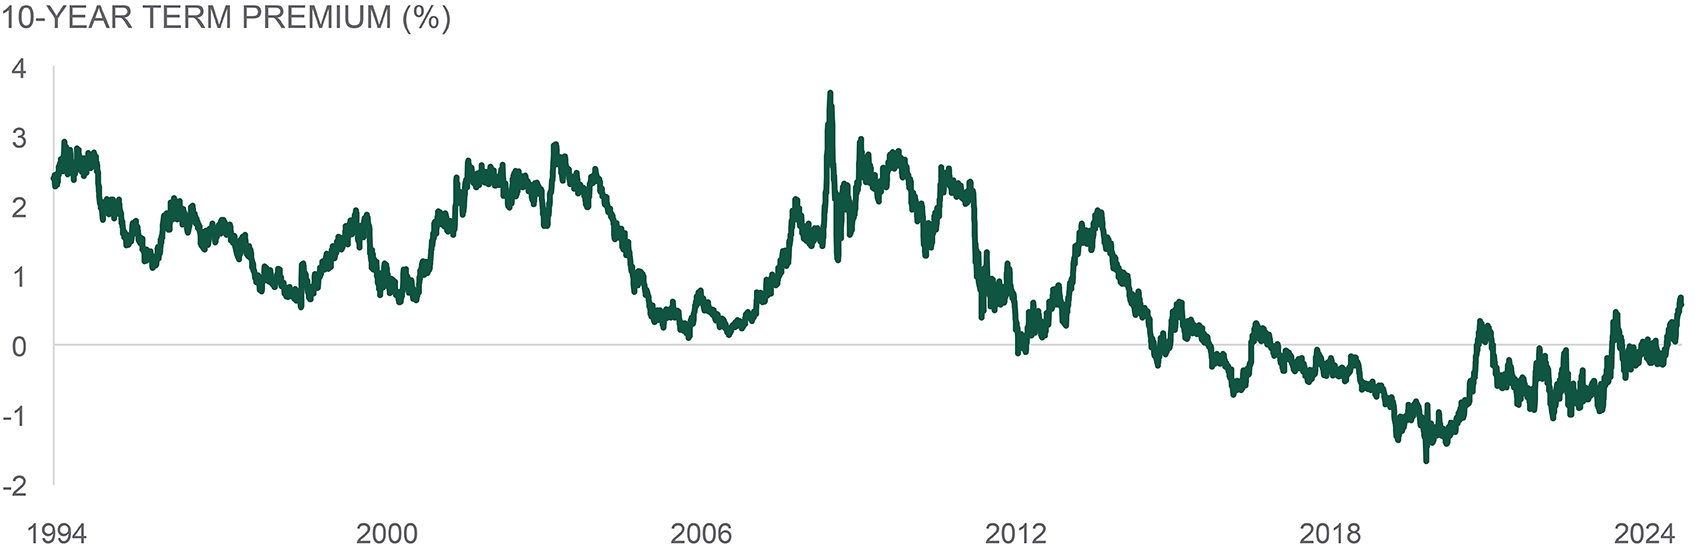
Source: Northern Trust Asset Management, Bloomberg. Tobias Adrian, Richard Crump, and Emanuel Moench (ACM Model). Data from 1/18/1994 through 1/14/2025. Historical trends are not predictive of future results.
Interest Rates
Rates markets are starting off the new year with substantially different expectations for the path of the Fed Funds Target range than just four months ago, when they began reducing rates with a 50bps “recalibration” at their September meeting. While the FOMC has already cut by a total of 100bps, Fed Funds Futures markets currently imply less than two additional 25bps cuts this year. Market based expectations for the future path of policy have changed quickly. A brief look back at last year may offer a cautionary tale.
Starting last year the FOMC was widely expected to lower interest rates in 2024, but expectations for the timing and magnitude of rate cuts varied meaningfully. In January of 2024, Fed Funds Futures markets implied as many six to seven 25bp reductions by the end of 2024. Markets dialed back rate cut expectations throughout the remainder of the first and second quarter. The FOMC ultimately held policy rates steady for more than a year before cutting at their September meeting. It’s entirely plausible the FOMC cuts twice this year, but it would be in response to how the economy is progressing rather than predictions from a volatile Fed Funds Futures market.
— Dan LaRocco, Head of U.S. Liquidity, Global Fixed Income
HERE WE GO AGAIN?
Similar to 2024, the number of Fed rate cut expectations could vary depending on how the economy progresses.
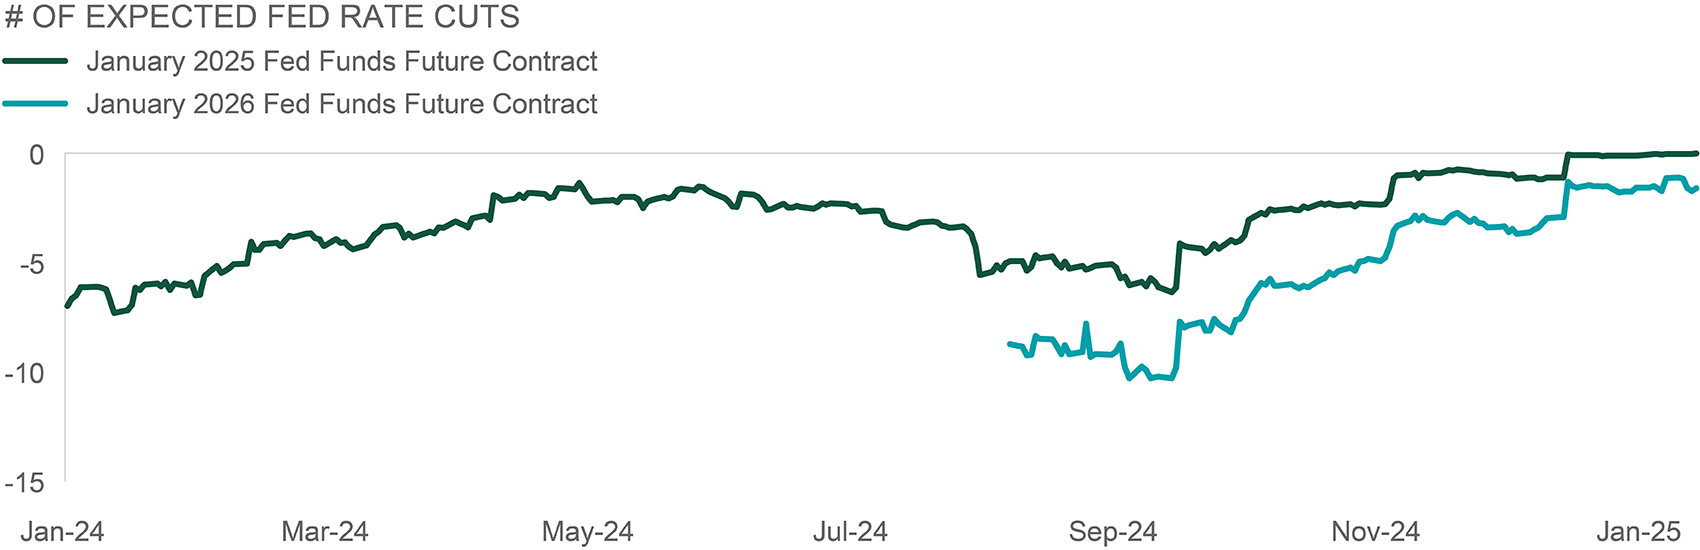
Source: Northern Trust Asset Management, Bloomberg. Data from 1/1/2024 through 1/17/2025. Historical trends are not predictive of future results.
- Market based expectations for the future path of policy have changed quickly.
- Accordingly, take the predictive power of fed funds futures markets with a grain of salt.
- A fairly wide range of outcomes with respect to the Federal Funds Target range are possible again in 2025.
Credit Markets
Following strong performance in November across risk assets, market participants began the month with a renewed focus on the Fed and the potential path forward for monetary policy. However, at the December FOMC meeting, the tone shifted from concern around future labor market weakness to more attention on stubbornly resilient inflation. Interest rates rose over the course of a month. Higher interest rates coupled with spread widening contributed to a negative return for high yield in December.
The backdrop in high yield (HY) continues to be supported by strong underlying fundamentals heading into 2025 as 3Q24 data unveiled relative stability in credit metrics. Leverage has increased to 4.05x from the record lows back in 1Q23, although that still leaves it below the historical average of 4.30x. Interest coverage decreased 0.23x to 4.66x, but it remains above the long-term average (4.50x). HY market valuations are likely to be supported by stable issuer fundamentals and a benign default outlook. These factors provide a strong backdrop for high levels of carry and total return potential. In our view spreads are more likely to be influenced by interest rates going forward, rather than deterioration in fundamentals.
— Eric Williams, Head of Capital Structure, Global Fixed Income
HIGH YIELD FUNDAMENTAL UPDATE
High yield market valuations are likely to be supported by stable issuer fundamentals and a benign default outlook.
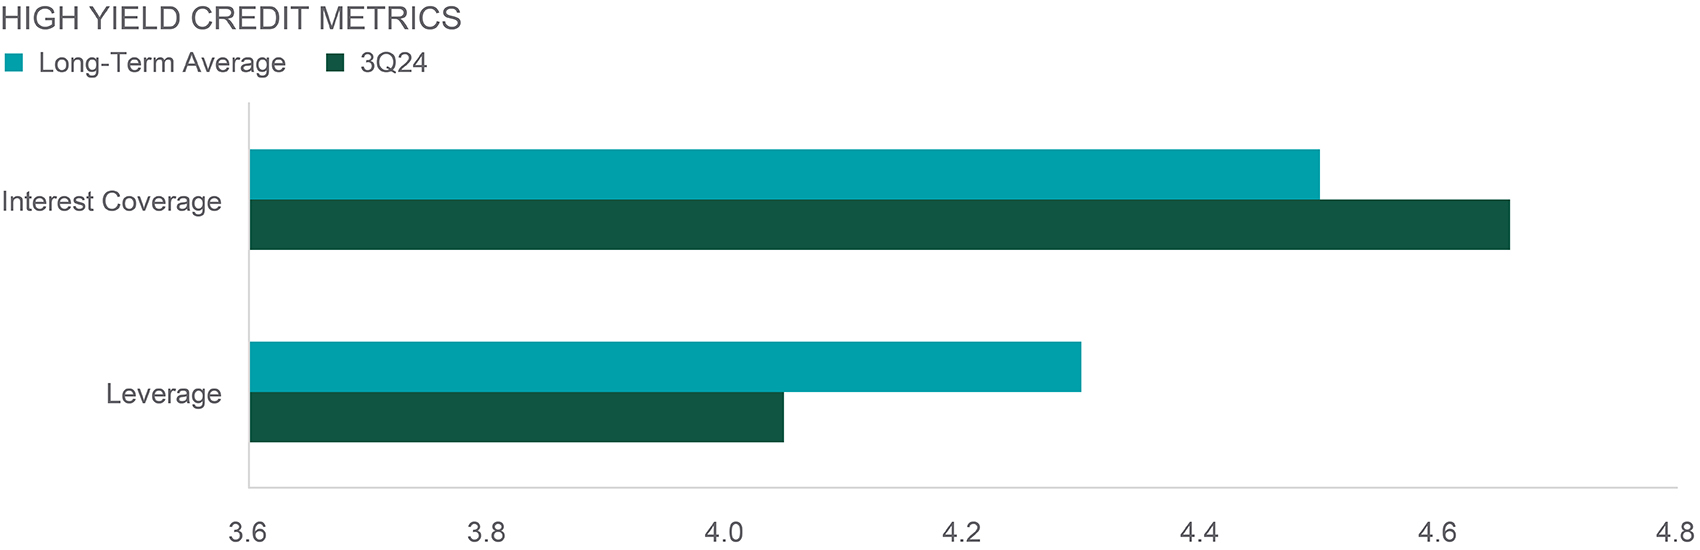
Sources: J.P. Morgan; S&P Capital IQ. Data from 1Q08 to 3Q24. Leverage = Debt/EBITDA. Interest coverage = EBITDA/Interest Expense. Past performance is not indicative or a guarantee of future results.
- The backdrop in high yield continues to be supported by strong underlying fundamentals heading into 2025 as 3Q24 data unveiled relative stability in credit metrics.
- Leverage has increased to 4.05x from the record lows back in 1Q23, although that still leaves it below the historical average of 4.30x.
- Interest coverage decreased 0.23x to 4.66x, but it remains above the long-term average of 4.50x.
EQUITIES
The last month highlighted the importance of the macroeconomic backdrop. Global equities weakened after the Fed delivered a hawkish rate cut in December. Each of the major regions fell lower for the month. U.S. large cap value has had a strong January so far and is outperforming U.S. large cap growth after significantly underperforming in December and across the full-year 2024. In December, many cyclical areas of the market (e.g. small caps, industrials, materials) shaved off a majority of their post-election returns as Fed rate cut expectations were scaled back. However, softer-than-expected U.S. inflation data provided a boost for risk-assets in mid-January, leading to a reversal of many of the above moves.
U.S. economic growth data has remained solid. Although U.S. equity valuations are above historical averages, a strong earnings backdrop continues to provide support. Given a subdued economic growth outlook in the Eurozone and uncertainty around tariffs, we remain underweight to developed ex-U.S equities. But we remain broadly overweight equities overall with a preference for the U.S. and a smaller overweight to emerging markets.
— Christian Lambert, Investment Analyst, Global Asset Allocation
MACRO MATTERS
Many cyclical areas of the market lost steam in December after a hawkish Fed cut.

Source: Northern Trust Asset Management, Bloomberg. Total return data from 11/5/2024 through 1/17/2025. U.S. Cyclicals includes large cap Industrials, Materials, and Energy sectors. Past performance is not indicative or a guarantee of future results. Index performance returns do not reflect any management fees, transaction costs or expenses. It is not possible to invest directly in any index.
- Softer-than-expected U.S. inflation data provided a boost for risk-assets in mid-January.
- Resilience in the U.S. economy and a supportive earnings backdrop has supported U.S. equity returns.
- We maintain overweights to the U.S. and emerging markets. We are underweight developed ex-U.S. equities.
REAL ASSETS
2024 was a good year for listed infrastructure. Strong earnings and momentum for energy midstream and a structural positive shift in the growth rate for utilities were tailwinds for the asset class. We believe the asset class is in a good position to continue to thrive as its defensive cash flows are more attractive in a slowing global economy. We also expect significant growth in capital expenditures from infrastructure modernization and improvements in transition. Asset class fundamentals are robust and the growth outlook is very strong.
Another important piece to the infrastructure puzzle is downside protection from global capital on the sidelines (over $346 billion of private capital according to Preqin). These funds could potentially provide a floor of support and downside protection for global listed infrastructure valuations. Also, private funds have had difficulty deploying capital and are acquiring assets at significant premiums over appraisals, representing upside for the listed space. With the combination of strong fundamentals and higher earnings growth, discounted valuations, and deep private capital interest, we are excited about the listed infrastructure sector heading into 2025.
— Jim Hardman, Head of Real Assets, Multi-Manager Solutions
PRIVATE MARKET SUPPORT FOR INFRA
Record demand from private market participants.
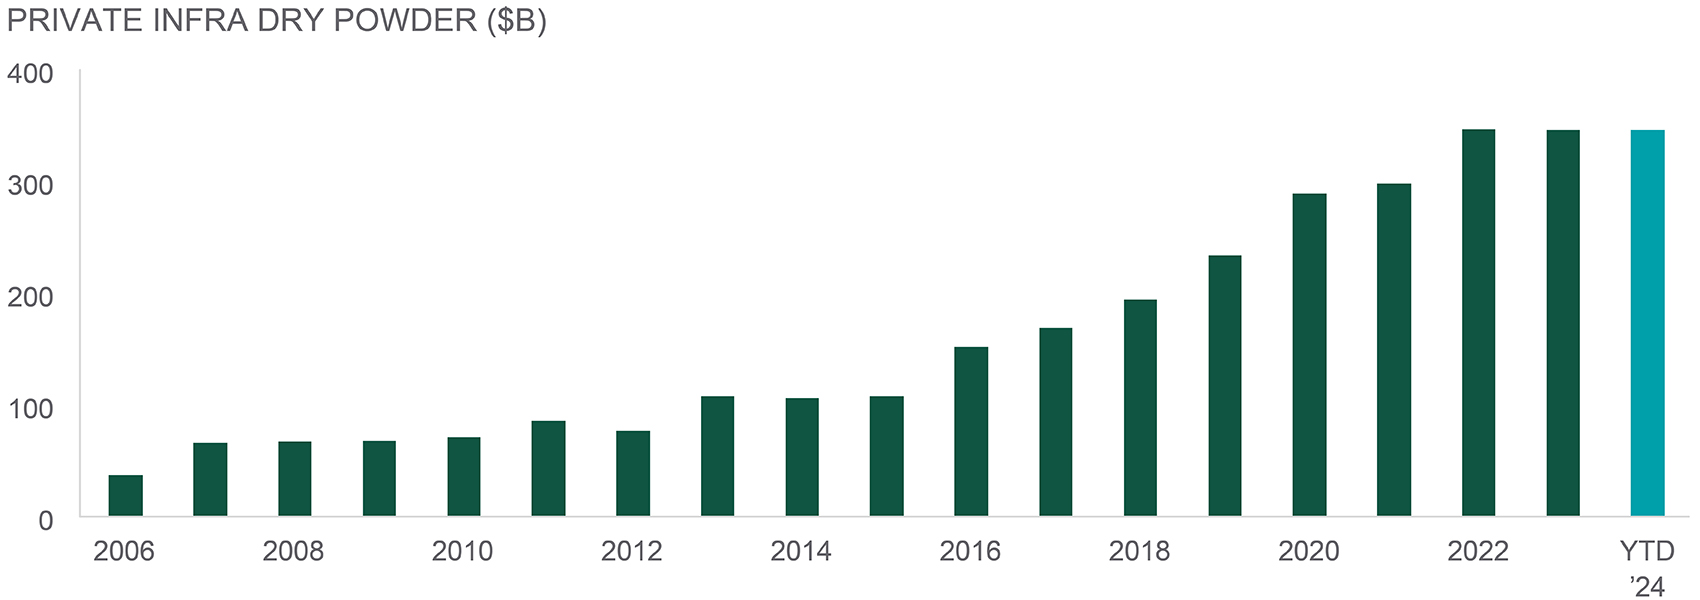
Source: Northern Trust Asset Management, Preqin, Goldman Sachs, Cohen & Steers. Historical trends are not predictive of future results.
- Private market capital could provide a floor of support and downside protection for listed infrastructure valuations.
- We confirm our overweight to infrastructure on strong fundamentals, robust earnings growth, discounted valuations, and record private market capital dry powder.
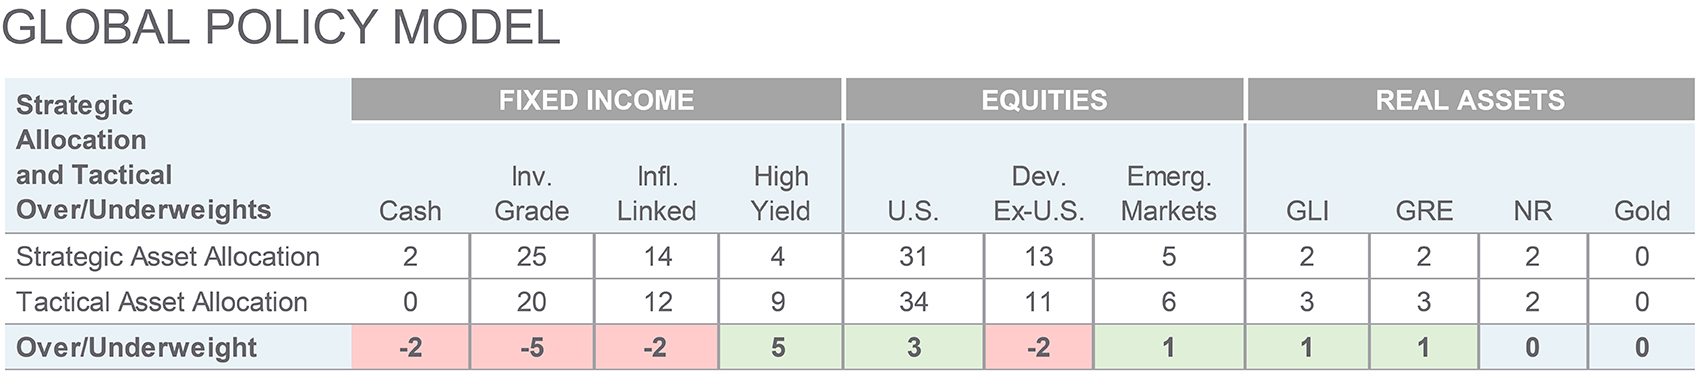
Source: Northern Trust Capital Market Assumptions Working Group, Investment Policy Committee. Strategic allocation is based on capital market return, risk and correlation assumptions developed annually; most recent model released 1/15/2025.The model cannot account for the impact that economic, market and other factors may have on the implementation and ongoing management of an actual investment strategy. Asset allocation does not guarantee a profit or protection against a loss in declining markets. GLI = Global Listed Infrastructure, GRE = Global Real Estate, NR = Natural Resources. Unless otherwise noted, the statements expressed herein are solely opinions of Northern Trust. Northern Trust does not make any representation, assurance, or other promise as to the accuracy, impact, or potential occurrence of any events or outcomes expressed in such opinions.
Unless noted otherwise, data on this page is sourced from Bloomberg as of January 2025.
IMPORTANT INFORMATION
Northern Trust Asset Management (NTAM) is composed of Northern Trust Investments, Inc., Northern Trust Global Investments Limited, Northern Trust Fund Managers (Ireland) Limited, Northern Trust Global Investments Japan, K.K., NT Global Advisors, Inc., 50 South Capital Advisors, LLC, Northern Trust Asset Management Australia Pty Ltd, and investment personnel of The Northern Trust Company of Hong Kong Limited and The Northern Trust Company.
Issued in the United Kingdom by Northern Trust Global Investments Limited, issued in the European Economic Association (“EEA”) by Northern Trust Fund Managers (Ireland) Limited, issued in Australia by Northern Trust Asset Management (Australia) Limited (ACN 648 476 019) which holds an Australian Financial Services Licence (License Number: 529895) and is regulated by the Australian Securities and Investments Commission (ASIC), and issued in Hong Kong by The Northern Trust Company of Hong Kong Limited which is regulated by the Hong Kong Securities and Futures Commission.
For Asia-Pacific (APAC) and Europe, Middle East and Africa (EMEA) markets, this information is directed to institutional, professional and wholesale clients or investors only and should not be relied upon by retail clients or investors. This information may not be edited, altered, revised, paraphrased, or otherwise modified without the prior written permission of NTAM. The information is not intended for distribution or use by any person in any jurisdiction where such distribution would be contrary to local law or regulation. NTAM may have positions in and may effect transactions in the markets, contracts and related investments different than described in this information. This information is obtained from sources believed to be reliable, its accuracy and completeness are not guaranteed, and is subject to change. Information does not constitute a recommendation of any investment strategy, is not intended as investment advice and does not take into account all the circumstances of each investor.
This report is provided for informational purposes only and is not intended to be, and should not be construed as, an offer, solicitation or recommendation with respect to any transaction and should not be treated as legal advice, investment advice or tax advice. Recipients should not rely upon this information as a substitute for obtaining specific legal or tax advice from their own professional legal or tax advisors. References to specific securities and their issuers are for illustrative purposes only and are not intended and should not be interpreted as recommendations to purchase or sell such securities. Indices and trademarks are the property of their respective owners. Information is subject to change based on market or other conditions.
All securities investing and trading activities risk the loss of capital. Each portfolio is subject to substantial risks including market risks, strategy risks, advisor risk, and risks with respect to its investment in other structures. There can be no assurance that any portfolio investment objectives will be achieved, or that any investment will achieve profits or avoid incurring substantial losses. No investment strategy or risk management technique can guarantee returns or eliminate risk in any market environment. Risk controls and models do not promise any level of performance or guarantee against loss of principal. Any discussion of risk management is intended to describe NTAM’s efforts to monitor and manage risk but does not imply low risk.
Past performance is not a guarantee of future results. Performance returns and the principal value of an investment will fluctuate. Performance returns contained herein are subject to revision by NTAM. Comparative indices shown are provided as an indication of the performance of a particular segment of the capital markets and/or alternative strategies in general. Index performance returns do not reflect any management fees, transaction costs or expenses. It is not possible to invest directly in any index. Net performance returns are reduced by investment management fees and other expenses relating to the management of the account. Gross performance returns contained herein include reinvestment of dividends and other earnings, transaction costs, and all fees and expenses other than investment management fees, unless indicated otherwise. For U.S. NTI prospects or clients, please refer to Part 2a of the Form ADV or consult an NTI representative for additional information on fees.
Hypothetical portfolio information provided does not represent results of an actual investment portfolio but reflects representative historical performance of the strategies, funds or accounts listed herein, which were selected with the benefit of hindsight. Hypothetical performance results do not reflect actual trading. No representation is being made that any portfolio will achieve a performance record similar to that shown. A hypothetical investment does not necessarily take into account the fees, risks, economic or market factors/conditions an investor might experience in actual trading. Hypothetical results may have under- or over-compensation for the impact, if any, of certain market factors such as lack of liquidity, economic or market factors/conditions. The investment returns of other clients may differ materially from the portfolio portrayed. There are numerous other factors related to the markets in general or to the implementation of any specific program that cannot be fully accounted for in the preparation of hypothetical performance results. The information is confidential and may not be duplicated in any form or disseminated without the prior consent of (NTI) or its affiliates.
Forward-looking statements and assumptions are NTAM’s current estimates or expectations of future events or future results based upon proprietary research and should not be construed as an estimate or promise of results that a portfolio may achieve. Actual results could differ materially from the results indicated by this information.
Not FDIC insured | May lose value | No bank guarantee